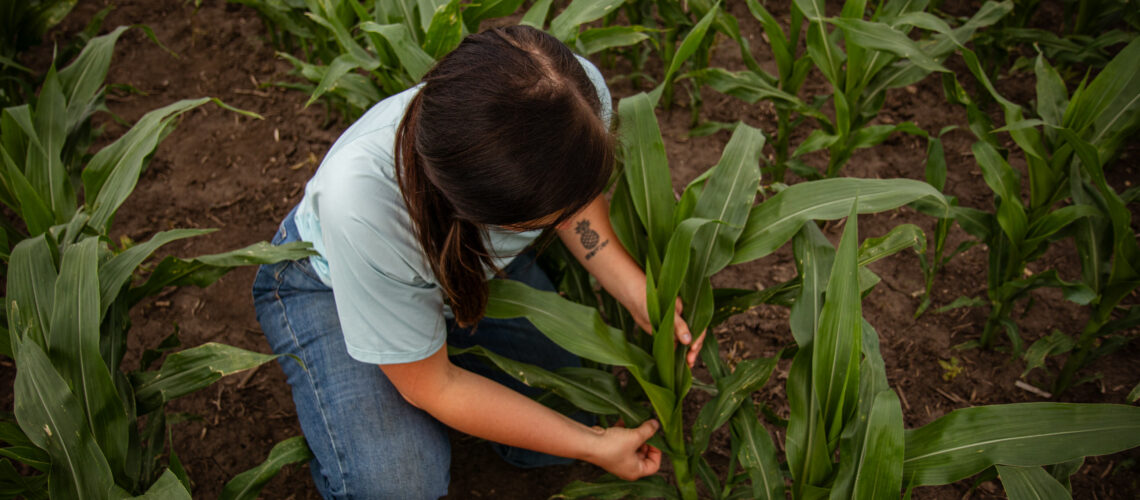
Dr. Cristie L. Preston is an Assistant Professor of Sustainable Cropping Systems at the Kansas State University Southeast Research-Extension Center, where her work focuses on soil fertility, crop nutrition, and cropping systems research and extension across the region. Before joining KSU, Dr. Preston served as a technical agronomist in industry, with expertise spanning corn, soybeans, and wheat production systems across the Corn Belt, Central Plains, and Mid-South. She is a Certified Crop Advisor and serves on the Kansas CCA Board. Dr. Preston earned her Ph.D. from Kansas State University in Agronomy and a M.S. in Soil and Environmental Science and B.S. in Animal Science from Virginia Tech. Dr. Preston has spent the last decade helping farmers bridge the yield gap by helping them make better Nutrient Management decisions.
Soil testing tells you what is in the soil before the crop grows. Tissue testing tells you what the crop is actually pulling out of it while it is growing. Different questions, different tools. But most of their value gets lost when people use one without the other.
Tissue sampling is underutilized enough in the Corn Belt, and when it does get used, it is often done wrong. The wrong plant part. The wrong growth stage. Results that come back from the lab two weeks after the correction window closed. Or worse, a number comes back below critical, and somebody sprays something without asking why it’s low in the first place.
What a tissue test can and cannot tell you
A tissue test is a snapshot. It measures nutrient concentration in the plant at the moment you pulled the sample. When done right, it can tell you whether the crop is short on something right now, and whether what you have already applied is actually getting taken up the way you would expect. When done wrong, or test results are read without context, it gives you a number that is easy to misread and expensive to act on.
It will not tell you why the crop is short. Low zinc at V6 could mean the soil’s genuinely short on zinc, but it could also mean a cold wet spring slowed availability, compaction kept roots from reaching it, or some root disease reduced uptake. A tissue test simply shows the deficiency, but it does not explain it. You still need the soil test, field history, and some judgment to figure out what’s actually going on.
It also cannot undo damage that has already been done. For instance, if a corn plant was phosphorus-starved from emergence through V5, the number might look fine again by the time you pull tissue at V8 because soils warmed up and the root system caught up. But that doesn’t mean anything happened to fix the kernel rows that already got locked in back at V5. The test is most useful when there’s still time to do something about what it shows. Past that point, you’re just documenting a loss that already occurred.
Getting the sample right
Four things determine whether your tissue result means anything: the plant part, the growth stage, the size of the sample, and how you handle it before it gets to the lab. Get any one of these wrong and the number you get back from your tissue test won’t line up with published critical values, so you cannot really use it.
Plant part
University critical values are tied to a specific tissue at a specific stage. You can’t swap them around. In order for them to be useful, you have to test the right plant part.
Corn: Whole plant from emergence to V6. Then, the uppermost leaf with a visible collar from V6 to tasseling. After tasseling, switch to the ear leaf, opposite and below the ear, which is what most published values are calibrated against.
Soybeans: Most recently matured trifoliate, upper canopy, during vegetative growth and early reproductive stages.
Wheat: Whole plant through Feekes 5, then flag leaf or uppermost expanded leaf from Feekes 5 to heading.
Cotton: Uppermost fully expanded leaf blade, no petiole, collected from squaring through early bloom.
Growth stage
The crop’s growth stage has to be recorded and matched to the right table because nutrient concentration in tissue shifts a lot as the plant grows, not because the crop is becoming more or less deficient. Corn leaf nitrogen runs something like 4.5 to 5.5 percent at V6 and drops to 2.5 to 3.5 percent by grain fill. That’s dilution – same nitrogen but way more plant tissue to spread it across. If you compare a grain-fill sample against a V6 critical value table, you will get a false deficiency result almost every time.
Sample size
The ideal sample size is between 15 to 25 plants or leaves, depending on what the lab wants. Be careful not to mix damaged or stressed plants with healthy ones. Submit those separately, or you will end up with an average that doesn’t actually describe either group.
Handling
This is the one most people get wrong. Use paper bags instead of plastic because plastic traps moisture, causing the sample to start degrading almost immediately. Keep the sample cool, out of the sun, and get it to the lab within a day. A sample that rode around in a hot truck cab for 48 hours is no longer telling you about crop nutrition. It’s telling you about decomposition.
If next-day shipping isn’t realistic, dry the sample yourself first. Most labs will accept pre-dried tissue if you call ahead.
Reference ranges by crop
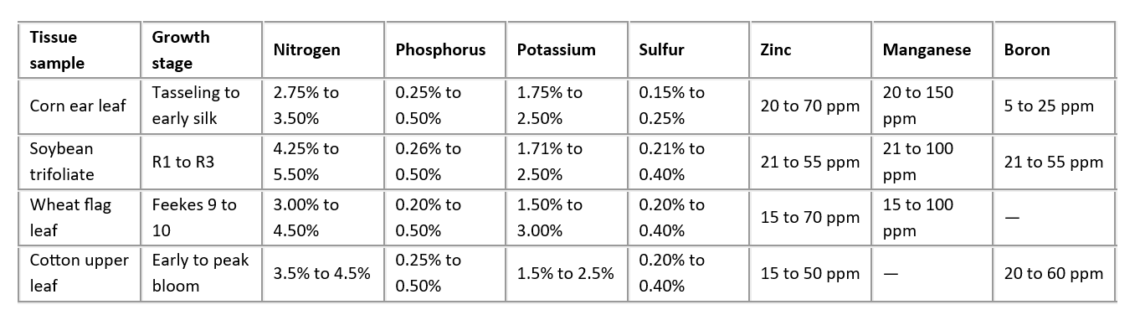
Table summary. The reference ranges show that nutrient sufficiency varies by crop, plant part, and growth stage, so the table should be used as a comparison guide rather than a universal deficiency scale. Among the crops listed, soybean trifoliates carry the highest nitrogen sufficiency range, wheat flag leaf shows the widest potassium range, and cotton upper leaves have the highest boron range. Sulfur ranges are generally higher in soybean, wheat, and cotton than in corn, while zinc and manganese ranges overlap broadly across crops.
Nitrogen: Soybeans have the highest sufficiency range at R1 to R3, reflecting the higher tissue nitrogen concentration expected in actively nodulating legumes.
Potassium: Wheat has the widest potassium range, while corn, soybean, and cotton ranges are closer together and top out near 2.5 percent.
Sulfur: Corn has the lowest listed sulfur range, while soybean, wheat, and cotton share higher upper-end values.
Boron: Cotton and soybean show higher boron ranges than corn; wheat has no listed boron value in this table.
Micronutrients: Zinc and manganese ranges overlap, but corn and wheat allow broader upper ranges for manganese than soybeans.
Common questions and tissue test scenarios
So, the number on your tissue test came back low. Now what?
A below-critical tissue result is a flag, but it’s not an instruction. There are three questions worth asking yourself before you act on the results.
1. Does the soil test back up the results? If corn at VT comes back low in potassium, but the field is sitting at 180 parts per million (ppm) soil test potassium with decent cation exchange capacity (CEC), and the season’s been wet enough, that’s probably not a real supply problem. It’s more likely that something temporarily knocked back root function: compaction, saturated soil, or maybe even disease. Spraying foliar potassium on that field treats a symptom you have not actually diagnosed, and it will not move yield.
Now take the same low potassium tissue result on a field testing 95 ppm on sandy ground in the middle of a dry July. That’s two separate data sources telling you the same thing, but in this situation the low potassium result is much more likely to reflect a true limitation.
General rule: If there’s a tissue deficiency plus a soil test deficiency, you act. If there’s a tissue deficiency alone with a soil test that disagrees, you look closer before you act.
2. Is there still time to fix it? Mobile nutrients like nitrogen, potassium, magnesium, and sulfur can move through the plant once you spray them on, so foliar correction still works through active growth. Immobile nutrients like calcium, boron, iron, manganese, and zinc do not translocate from old tissue to new. The spray has to land directly on growing tissue to do any good. For corn, that window mostly closes around tasseling. For soybeans, you have until R3 to R4.
Cotton’s boron window runs from first square through peak bloom. Anytime past that and you are not helping this year’s crop no matter what you spray.
3. Is the whole field actually short, or just part of it? Twenty plants pulled across a hundred acres gives you a field average. If the real problem is a wet corner, an eroded ridge, or a compacted end row, blanket-spraying the whole field to fix a fifteen-acre spot is a waste of product. Walk it before you spray it.
Using tissue data over time, not just in the moment
The biggest value in tissue testing isn’t catching a problem this year; it is building a record across crop years, so you can see things coming before they become a yield problem. Sample in the same field, at the same growth stage, every year. That is how you separate a real trend from one weird sample.
A grower pulling corn tissue at VT year-after-year on the same fields starts to see things: potassium trending down as soil test potassium drops, sulfur consistently sitting near the bottom of the range suggesting the program’s a little light on it, or zinc that’s been comfortably above critical for five straight years, which is a real conversation to have about whether that zinc application is even doing anything anymore. One low result in August might just be a hot, dry fluke, but three years running that is not a fluke.
Tissue data combined with soil tests and a yield map gives you the fullest picture you are going to get on a field’s nutritional status. None of these tools can answer everything alone, but together they get you a lot closer, and a lot closer than simply guessing.
Learn more about plant tissue sampling and testing in the following eKonomics resources: