


Crop Potassium Deficiency Under Challenging Conditions
Dr. Karl Wyant – Director of Agronomy, Nutrien
Lyle Cowell – Senior Agronomist, Nutrien
Dr. John Jones – Soil Fertility & Nutrient Management Researcher University of Wisconsin – Madison
Recent Drought Conditions
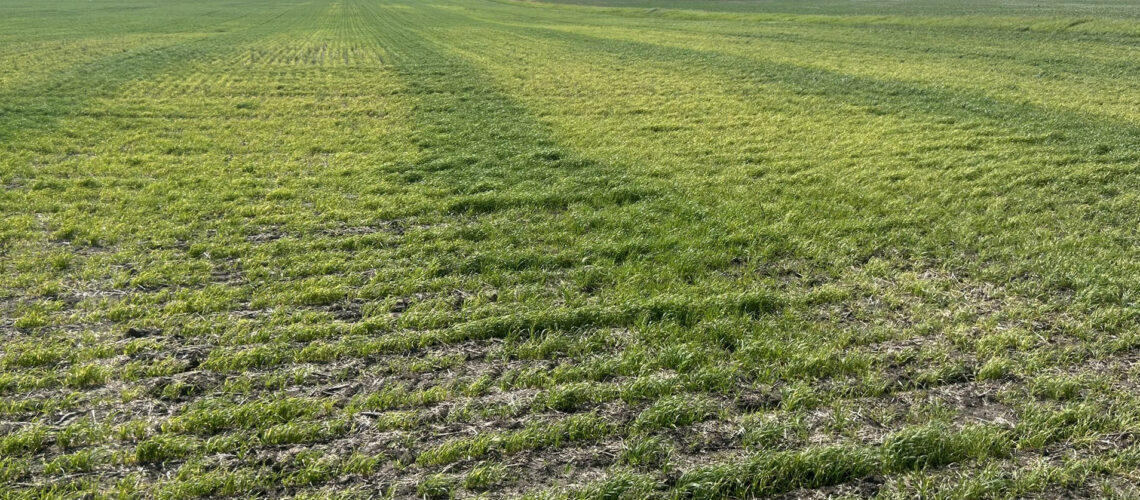
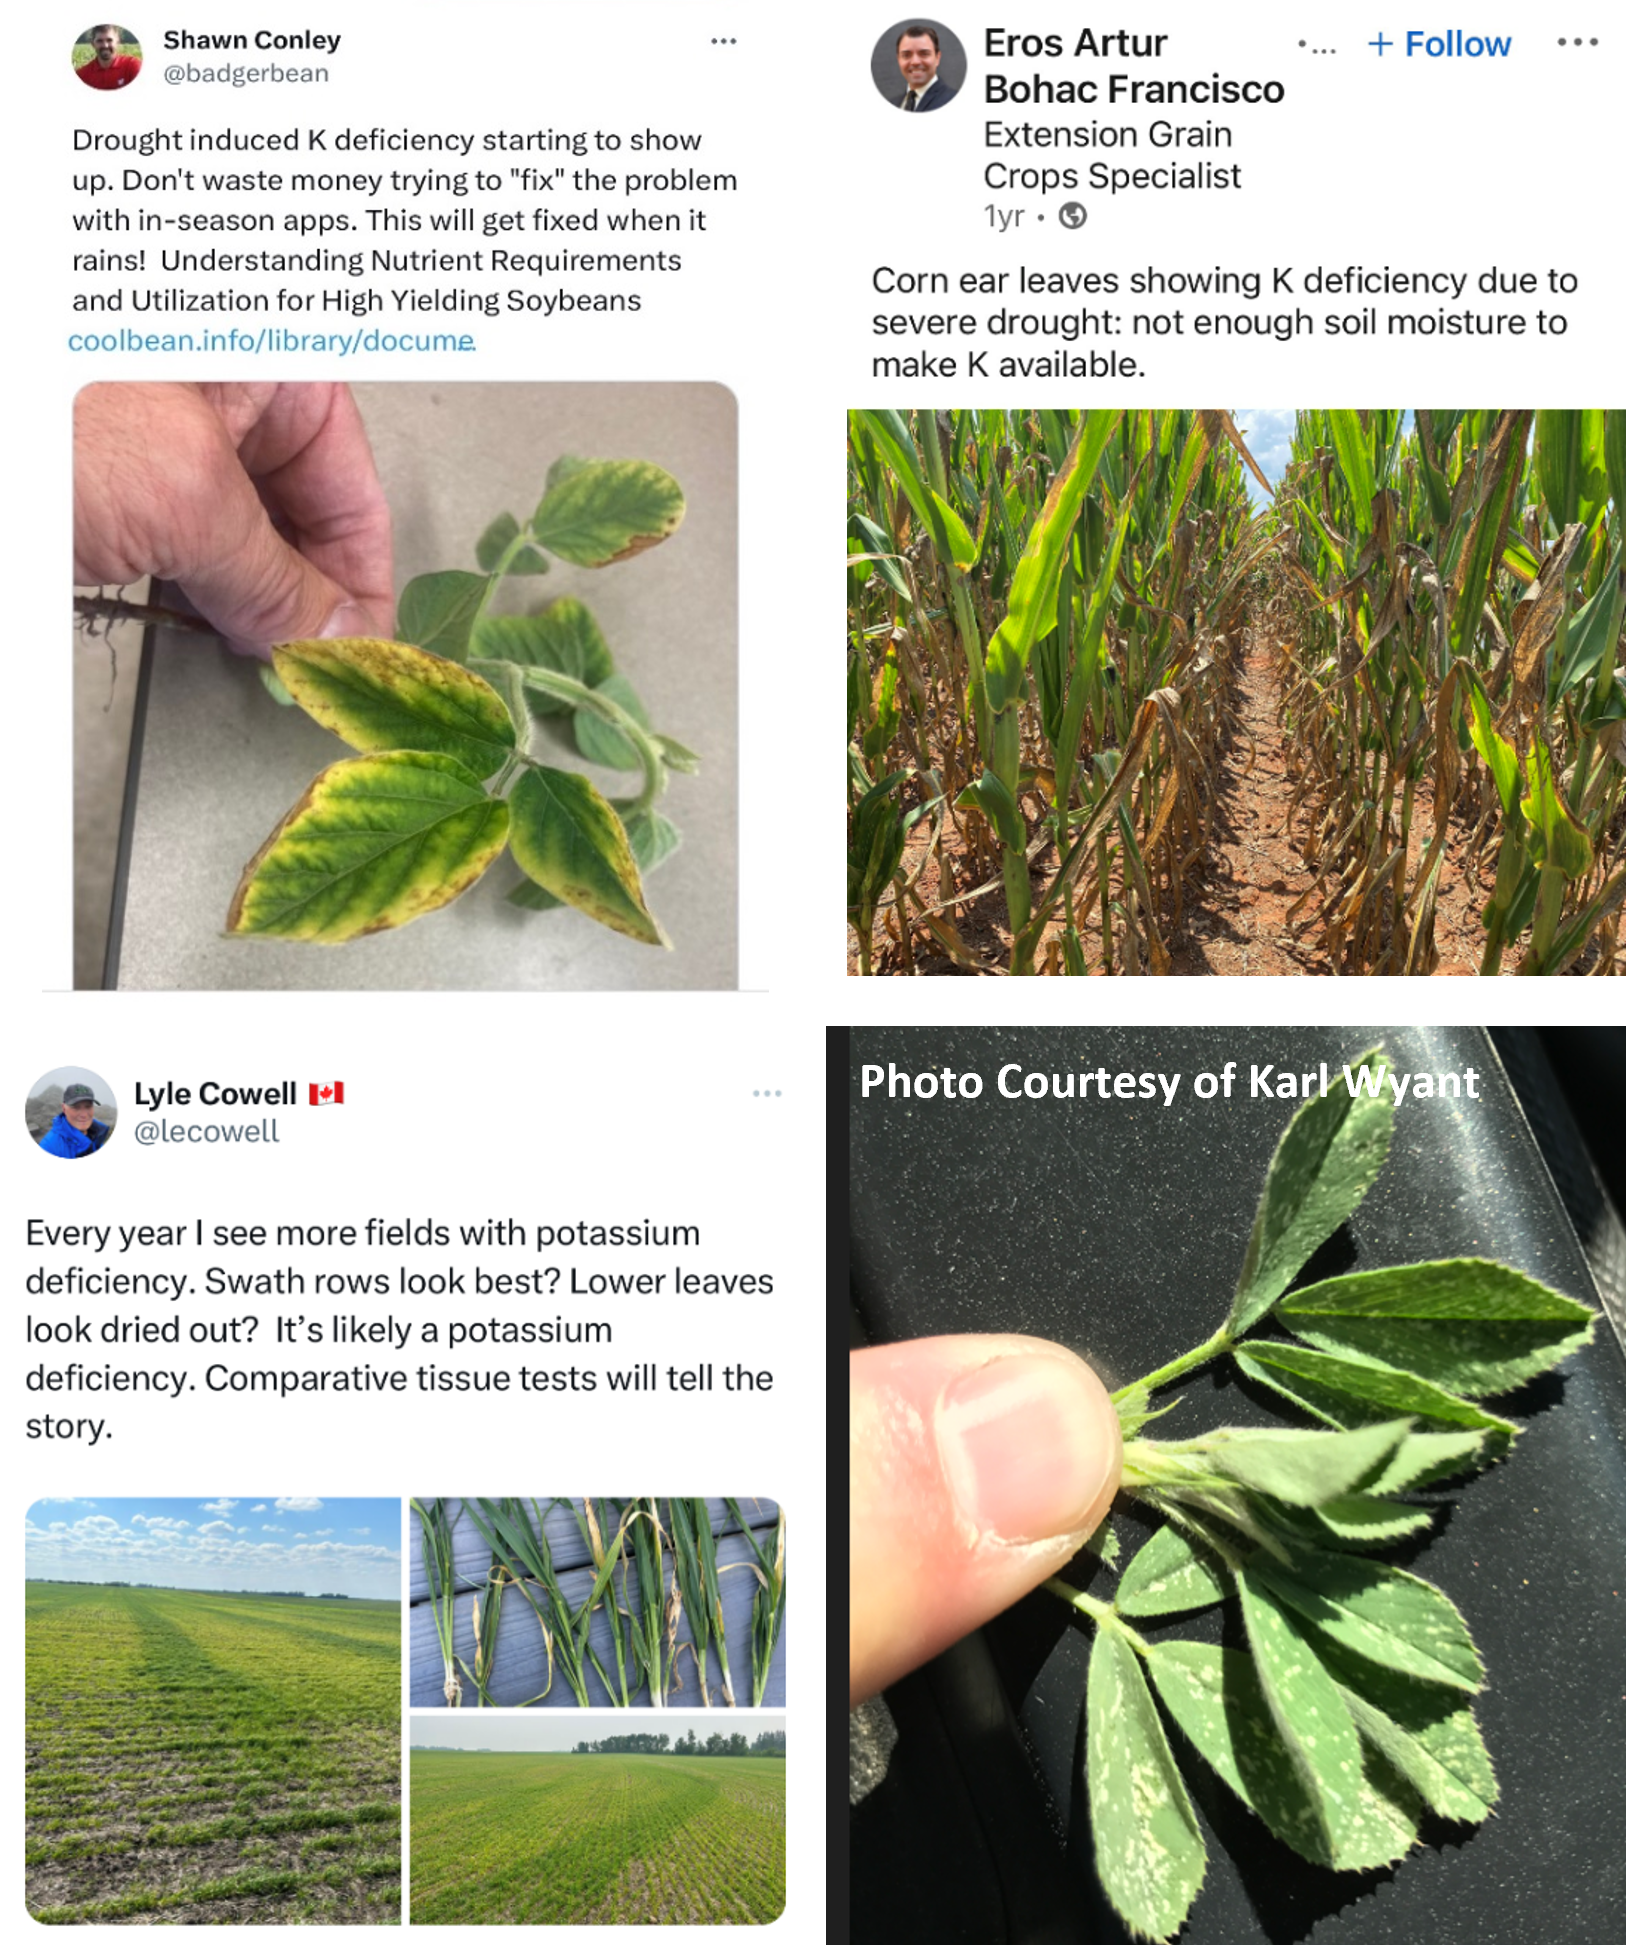
Over recent growing seasons, we have observed and seen reports of potassium deficiency across our territories (Figure 1). While some blame the drought and dry soil conditions, we also know that many of our soils are continuing to show lower potassium supply levels. In this article, we will discuss how potassium deficiency can be forced by two interacting soil conditions: potassium soil supply and drought stress (e.g., low soil moisture) and what to do about it.
The Last Few Years
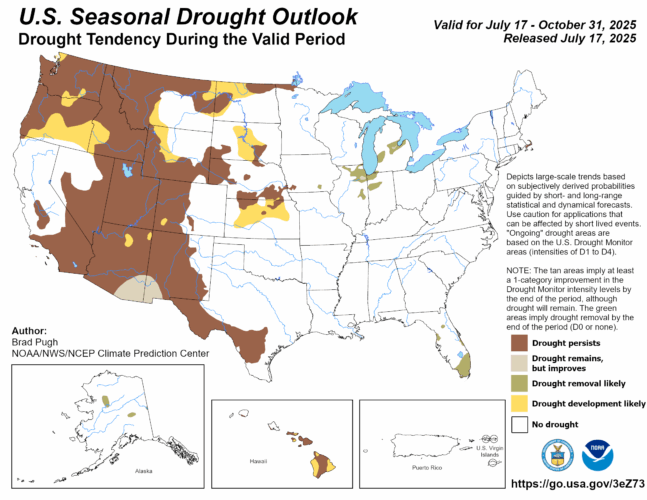
Drought stress was felt and seen across many dryland acres in 2023 and 2025 (see the comparison below by toggling between the 2023 and 2025 maps in Figure 2 and explore the 2025 seasonal drought outlook in Figure 3).
Dry soils can drive potassium deficiency because the K+ ions cannot move through the soil solution (the liquid phase) to be taken up via mass flow nor can the ions move properly via diffusion to the root tips. Also, potassium-containing fertilizers may not properly dissolve and deliver nutrients to the crop when the soil is dry. A few of our agronomy peers advised that “potassium deficiency would resolve itself once the rains came in” during the 2023 drought, however, we also know that farm soils are becoming increasingly deficient in potassium. Some farms may have experienced soil conditions that promote potassium deficiency when the soil supply of potassium is low and is drier than usual.
U.S. Drought Monitor
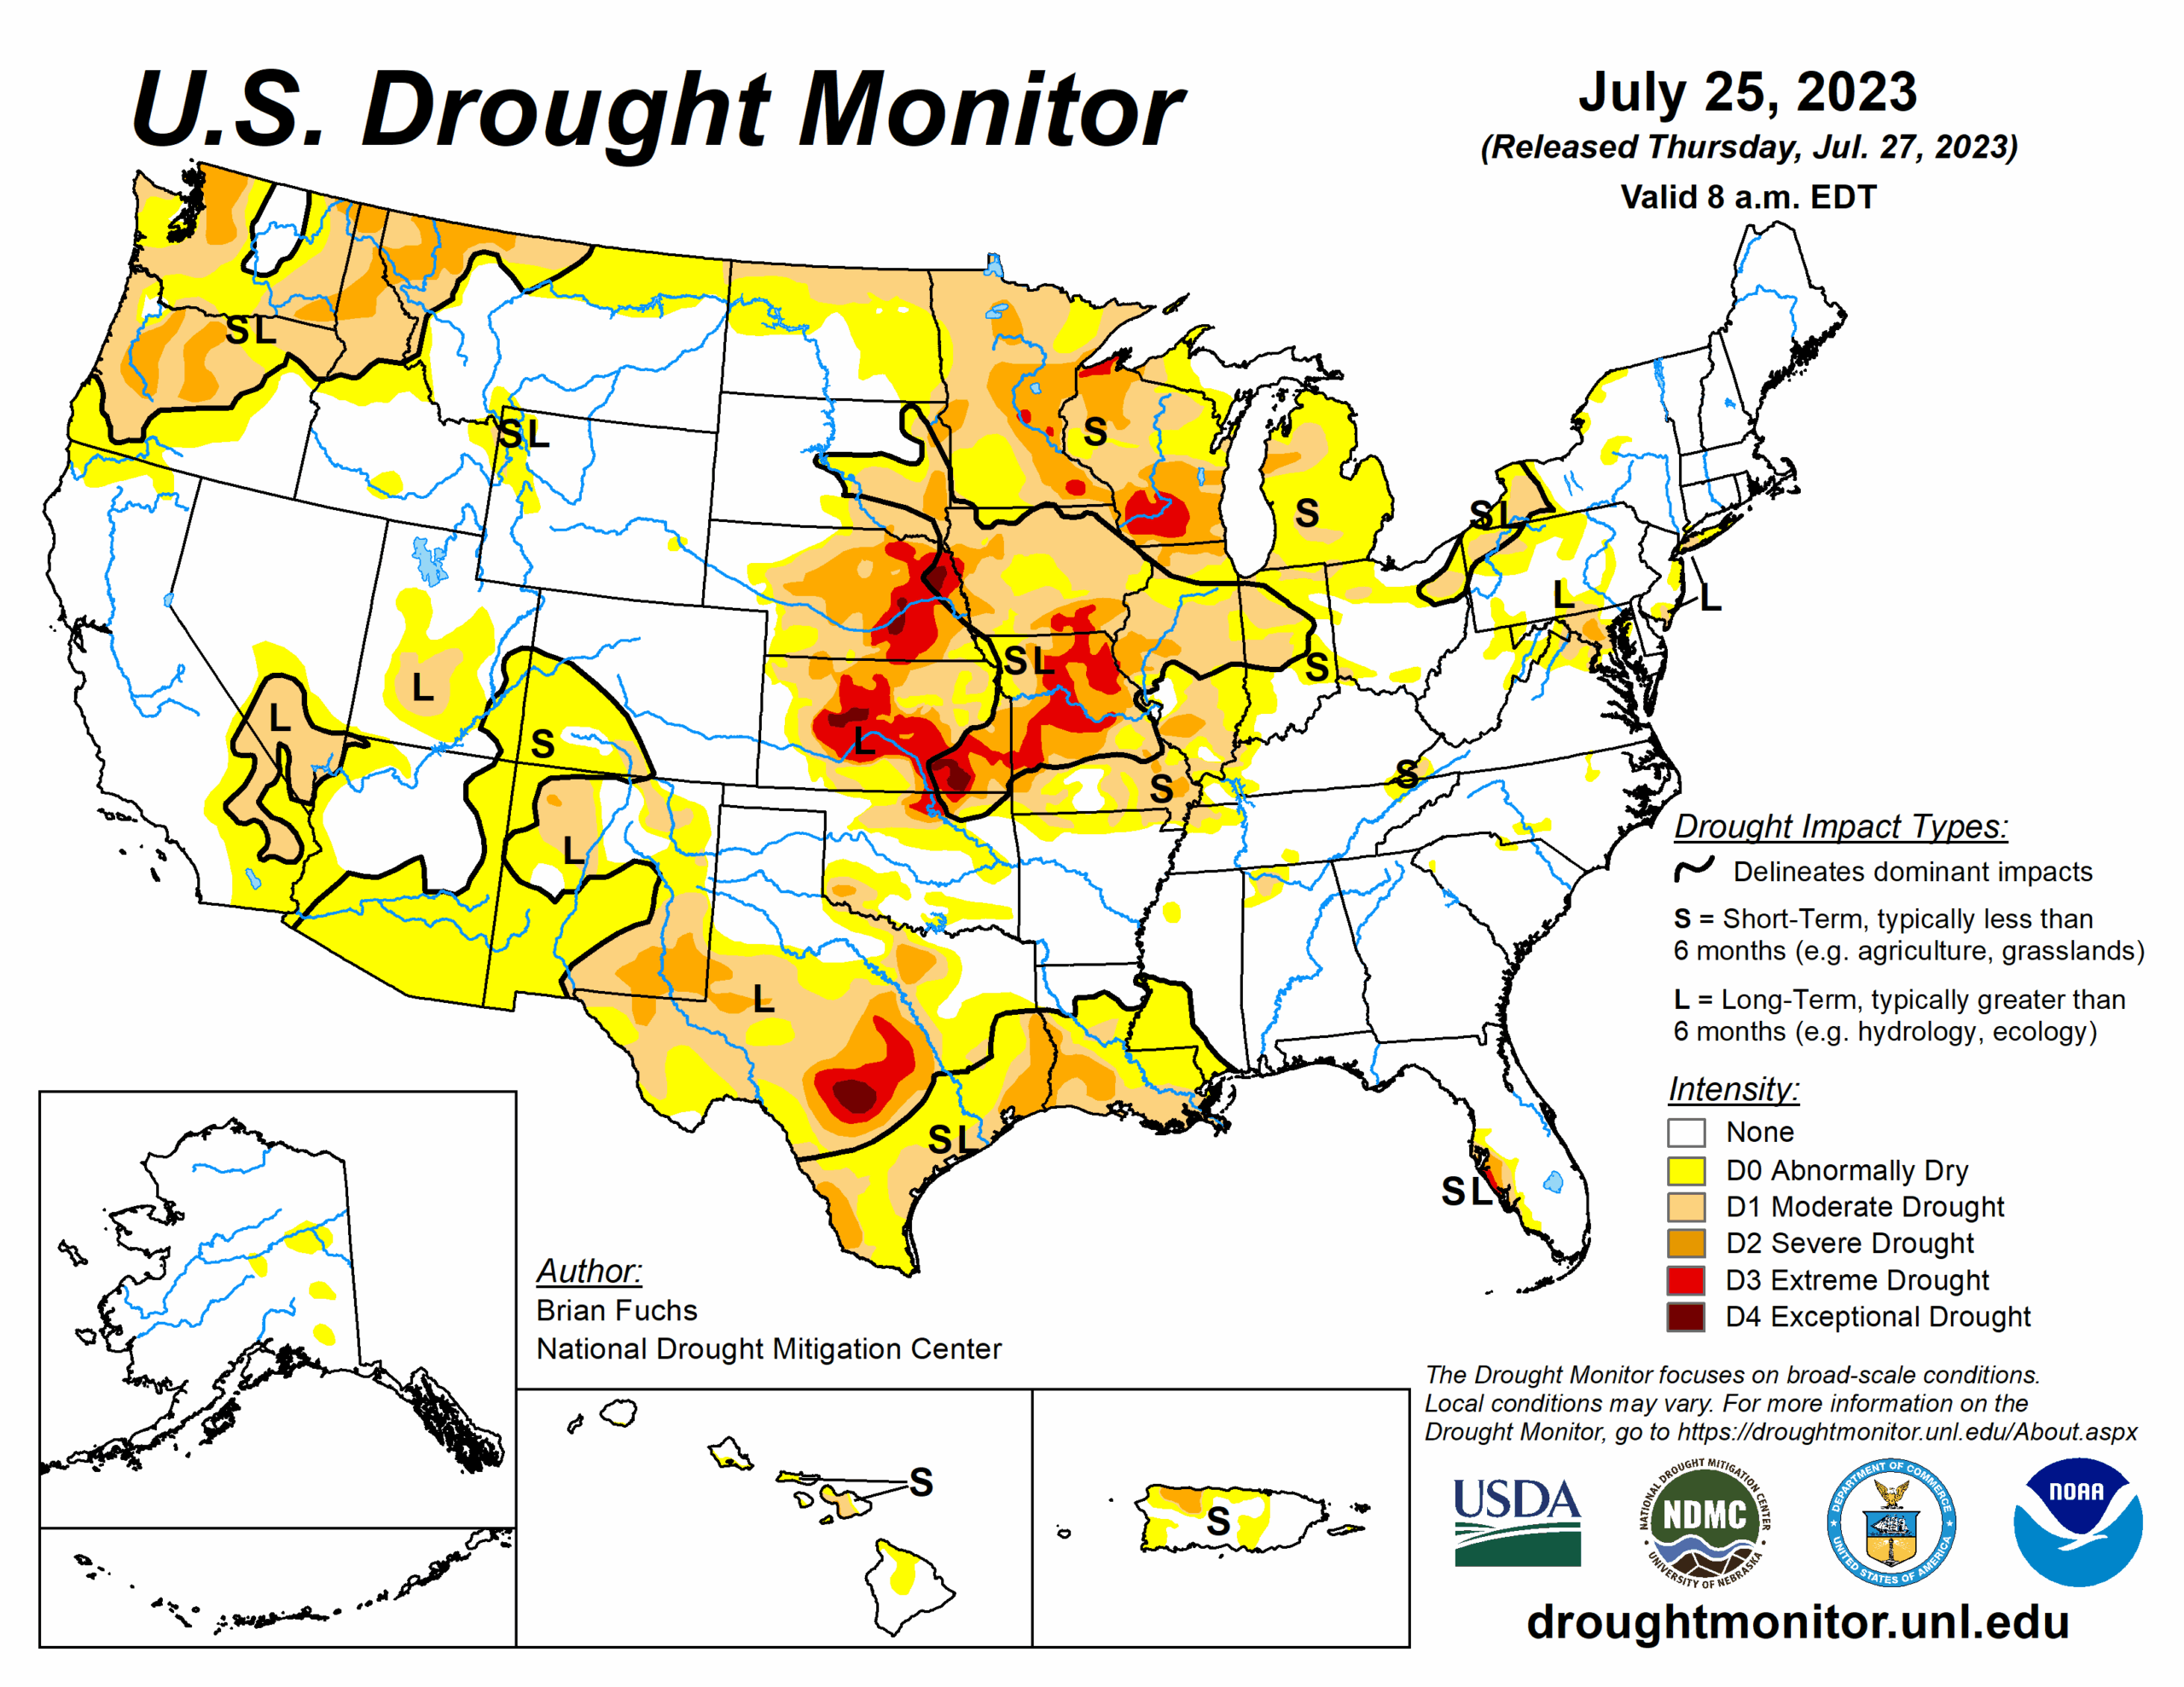

Figure 2 – Drought maps for late July 2023 and mid-June 2025 in the United States. Find your location on the map to see how drought may have impacted the growth and possible potassium uptake by your crop. Red shaded areas were particularly hit hard by dry conditions. Sources: droughtmonitor.unl.edu and Climate Prediction Center.
Growing Soil Potassium Deficiency and Critical Values
We know that soil potassium deficiency is trending upwards based on the analysis of over two million soil samples across the United States and Canada (TFI 2020). This is due to several factors including potassium soil removal rates in the harvested part of the crop that are outpacing the input rates of potassium back to the soil (e.g., from fertilizer).
The Potassium Budget Imbalance
The ‘potassium budget’ has been out of balance (potassium removals > potassium inputs) for many years and, as a result, the percentage of soil tests that are prone to deficiency continue to increase year over year. TFI (2020) mapped the results of their 2020 survey, and the percentage of soil samples below established critical values raised concerns (Figure 4).
Understanding Critical Values for Soil Potassium
The percentages shown in the middle of each province or state are the soil samples that test below the established critical value for soil potassium. A critical value refers to the result of a soil test derived from many years of experimentation on connecting soil test values, fertilizer response, and crop yield. A critical level is tied to a specific nutrient metric in the soil on the X axis (e.g., potassium PPM), and the corresponding yield is shown on the Y axis. Many years of testing will reveal that there is a certain level of a soil nutrient that supplies optimum yield (100 percent). Below this point, crop yield may decrease quickly, and a fertilizer response is highly likely. Above this point, the crop does not respond, and the fertilizer cost may not call for the expected yield return.

So, what is driving the increased observation in potassium crop deficiency symptoms over recent years? Is it dry soil due to drought or is it low soil potassium levels? Read below for an explanation on how two factors (drought intensity x soil potassium levels) interact with each other to influence potassium uptake and crop yield.
Some Explanation on Drought Intensity x Soil Potassium Levels
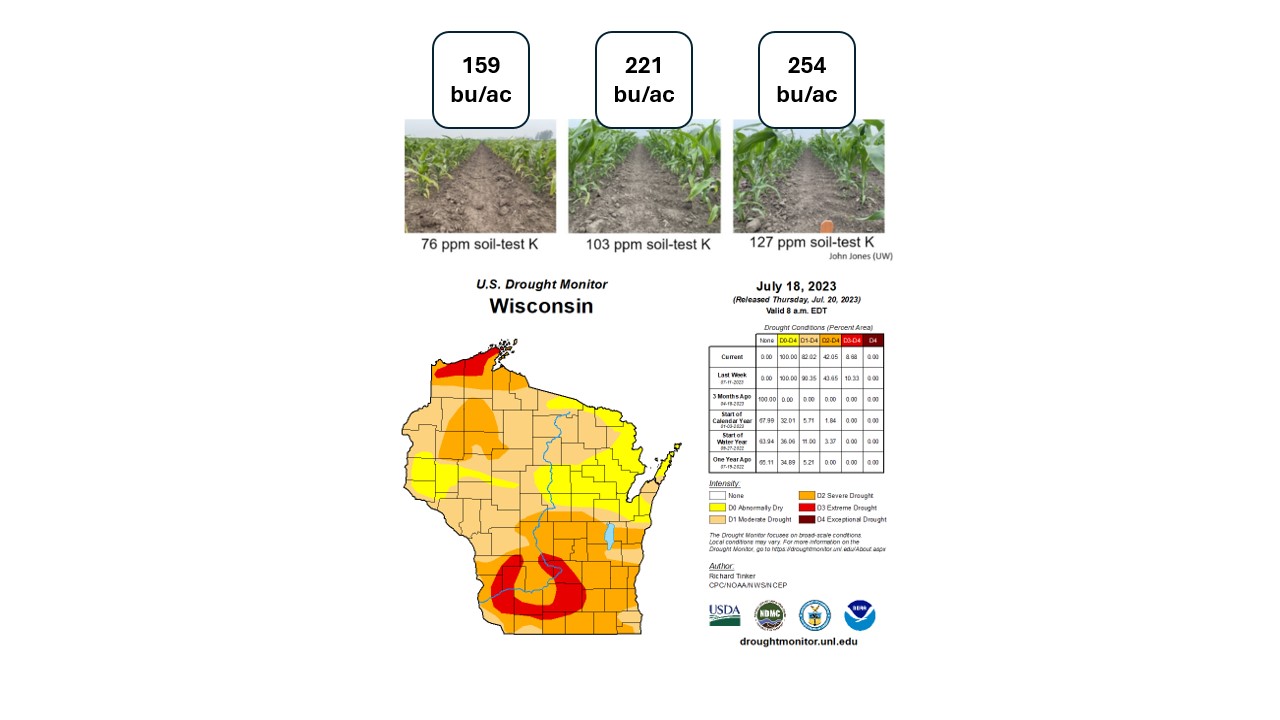
In a recent social media post, Dr. John Jones from University of Wisconsin – Madison showed how drought and potassium supply can interact to influence crop performance (Figure 5). In the post, Dr. Jones showed several photos of corn growing under different soil potassium levels and their average yield (left – poor potassium supply; middle – OK potassium supply; right – optimal potassium supply). These plots are in the same area and subjected to D3 extreme drought stress (see green star on map below). The photos clearly show an interaction between drought intensity and soil potassium levels and their effect on yield.
Notice the differences in corn growth across the low potassium/drought stress to higher potassium/drought stress spectrum. Dr. Jones concluded that crops grown in soils with optimal potassium levels or higher should perform better under lower soil moisture conditions than their potassium deficient counterpart, assuming nothing else restricted crop growth. This is a great example of how drought conditions (e.g., soil moisture) can interact with soil potassium supply to produce an impact on crop growth.
Uptake and Removal Data
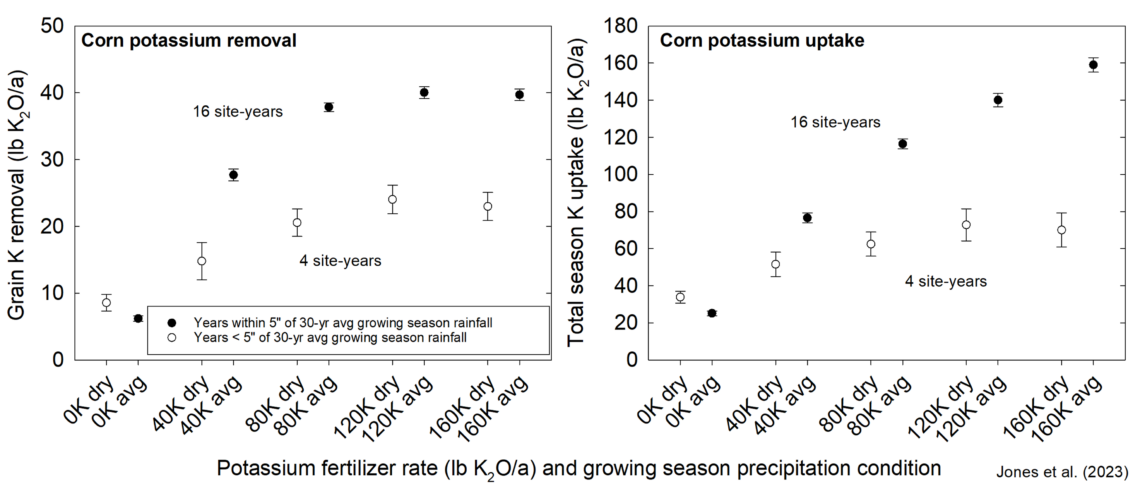
Dr. Jones, in a separate webinar, discussed the interaction of potassium supply on potassium uptake (Figure 6 – right) and potassium removal from the harvested portion of the crop (Figure 6 – left). The dark circles represent years when growing season precipitation did not deviate much from the 30-year average and the open circles represent data from drier years. The corn crop shows higher total potassium uptake when soil moisture conditions are conducive to nutrient movement and uptake (dark marks, right graph).
On the other hand, nutrient movement and crop uptake is limited in dry conditions and this is reflected in the graph (open circle, right graph). Since removal of potassium from the field moves in tandem with uptake, it is not surprising that a crop grown under dry conditions removes much less potassium relative to corn grown under more optimal conditions (see left graph). This becomes important for fertilizer budgets for the crop planted AFTER the drought, as some nutrients will still be available to drive crop growth in the next season.
Yield Data
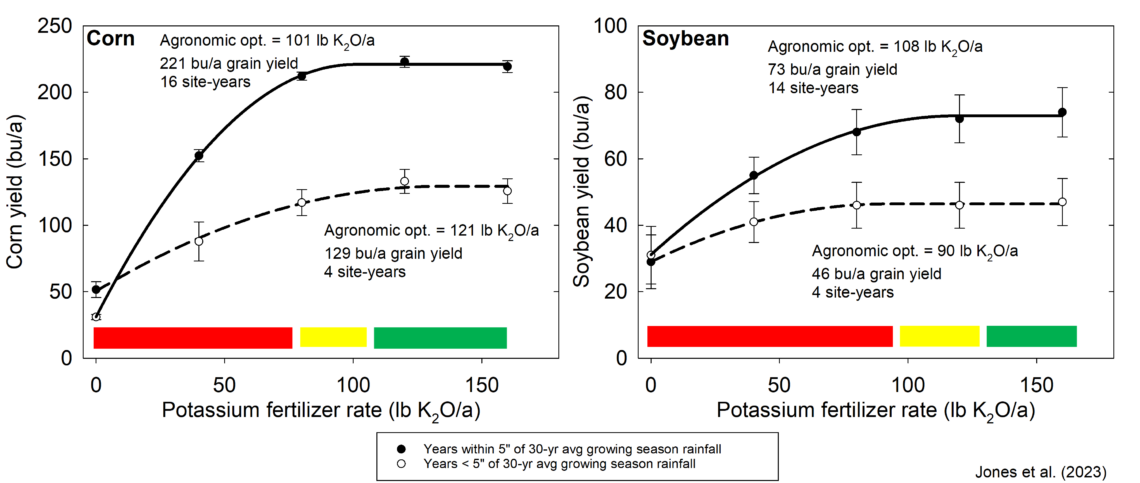
So, what does the yield data tell us about how soil potassium supply and droughty, dry soils interact? We can illustrate the interaction below with corn (Figure 7 – left) and soybean (Figure 7 – right). Wetter, more optimal years are marked by solid symbols while crops grown under dry conditions are marked with open circles.
Key Takeaways
- At low soil potassium levels (red bar), the crops grown under optimal conditions can produce much higher yields than their drought-stricken counterparts, indicating a moisture limitation. This is not surprising. However, on the line for the dry years, yield responses to potassium fertilization differ with corn requiring higher soil test potassium and soybean lower. This tells us that, under low soil moisture conditions, potassium supply begins to affect yield in a major way and that potassium fertilizer applications should maintain priority in a crop nutrient management plan.
- On the other hand, keeping high levels of potassium in the soil, beyond the optimum range (green bar), is not going to provide much ‘insurance’ for yield, dry or wet year, relative to optimum potassium conditions. This region of soil test ranges does not support high probabilities of agronomic or economic returns to potassium fertilization, however, fields in this range may require potassium to prevent crop removal of potassium from pushing soil test levels too low over the long term.
- When considering how yields will respond near the critical concentrations of soil test potassium (yellow bar), you can see how annual moisture fluctuations might be of more concern. In this range, large previous potassium removal amounts, or dry conditions may lead to observed deficiencies. The probability of yield responses to potassium fertilization is commonly double that of the green range, and goals should be to supply enough potassium to optimize yield and replenish removal if necessary. Notice the yellow bar is narrower than the others, requiring both accurate removal estimates and up-to-date soil test level numbers to watch closely.
Organizing Our Thoughts
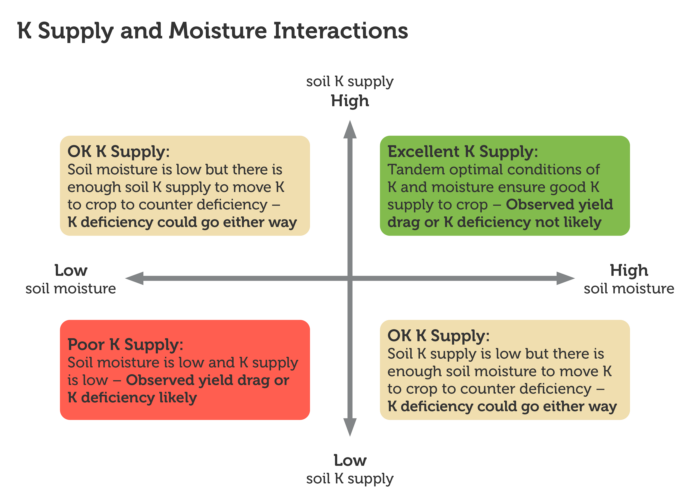
Because soil potassium supply interacts with the dry conditions forced by drought, we can think about our potassium supply to the crop in three different ways (Figure 7).
- Under optimal soil potassium and moisture conditions, excellent potassium uptake and yields can be achieved (green box).
- Under conditions with poor potassium supply and dry soil, a decline in crop performance and yield is expected due to the one-two punch of simultaneous potassium nutrient deficiency and unavailable soil moisture (red box).
- Not surprisingly, it is the subtle areas of these two end points where we need to pay the most attention (yellow boxes). Under the two interacting conditions of droughty, dry soil and soil potassium supply, the system can tilt to a yield limiting direction very quickly (see Figure 1 for reminder). This is where proactive planning and management are important. When these conditions are observed, irrigation can be turned on (lower right bow) or prescriptive fertilizer applications can be made (upper left box).
Next Steps
Drought intensity and soil potassium levels interact with each other to influence potassium uptake and crop yield. However, there is some nuance to the relationship that is worth some consideration. As we move into soil sampling season, it is important to run a ‘systems check’ to help explain any observed potassium deficiency this year and to also calibrate future potassium applications. Dr. Jones makes the following notes:
- Optimum soil-test potassium levels should supply sufficient nutrients in dry conditions – water stress is restricting other physiological processes.
- Side-dressing potassium may only supply a response in low testing soils.
- Variable in-field potassium deficiencies may indicate low soil-test potassium or “troublesome” soils – great opportunity to zone soil sample and apply potassium where it is needed most.
- Crop removal values will be affected by drought and generally leave potassium “behind” that can be used by the next crop. Consider this in upcoming fertilizer plans and adjust fertilizer application rates accordingly.
- Consider soil conditions (particularly abnormally dry soil conditions) when interpreting soil pH and potassium soil test results for samples collected in fall during drought years – they may deviate from when moisture is sufficient.
Further Reading
- Potassium and Drought: A Two-fold Water Uptake Problem – Agvise Laboratories
- Nutrient Uptake Considerations Under Drought (nutrien-ekonomics.com)
Citations
- Jones, J.D., Laboski, C.A., Arriaga, F.J. (2023). Soil Fertility Challenges in a Dry 2023. 2023 Badger Crop Connect Meeting. Univ. Wisconsin-Madison.
- The Fertilizer Institute. 2020. Soil Test Levels in North America: Summary Update.


